
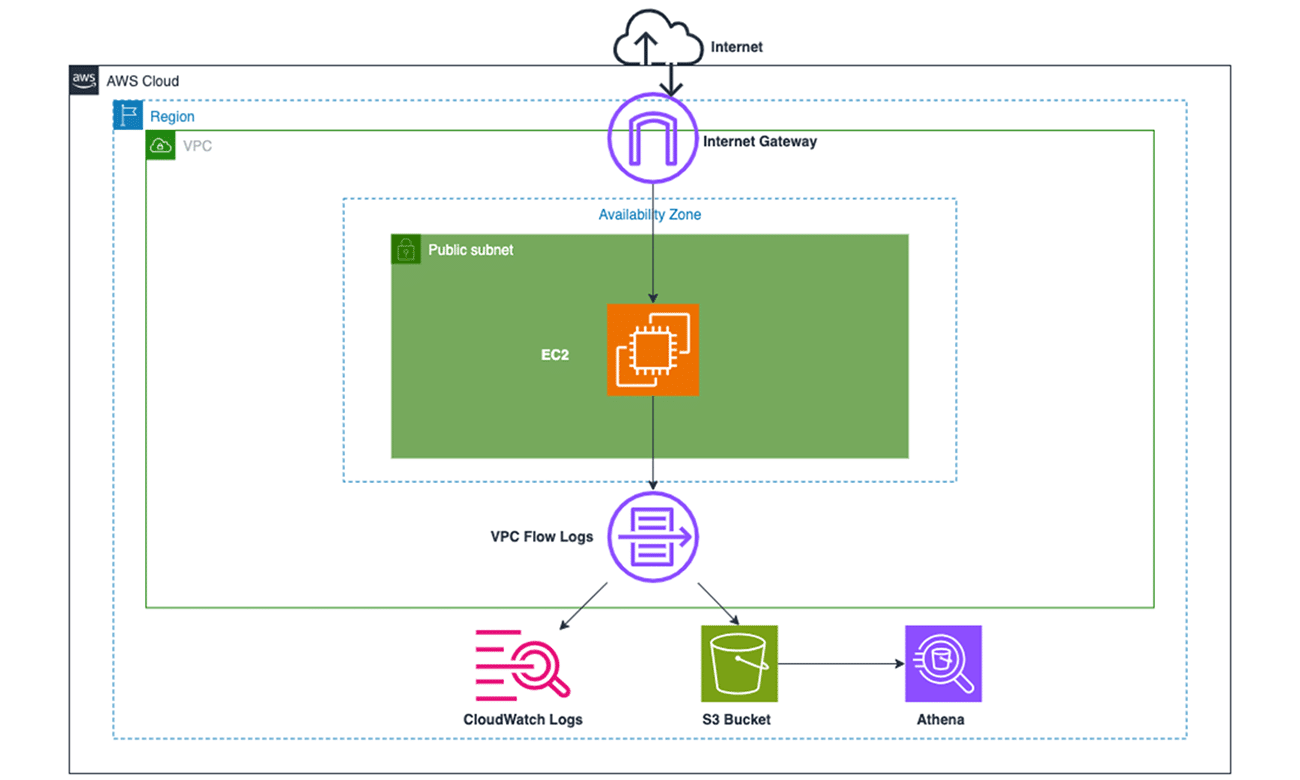
Build a Network Monitoring Solution Using AWS VPC Flow Logs and CloudWatch
To implement this step, you need to set up a new VPC and create a public subnet in this VPC. You will provision an Internet Gateway and make route entries for the Internet Gateway in the main Route Table for the given VPC.
- Make sure that you are in the N.Virginia AWS Region on the AWS Management Console. Enter VPC in the search bar and select VPC service.

2. Let’s create a new VPC that will be used to create the VPC Flow Log in a subsequent task.
a.Click on the Your VPCs link in the left sidebar and then click the ” Create VPC button

b. Enter the following values to create the VPC:
Resources to create: VPC only
Name-tag: Lab-VPC-Flow-Logs
IPv4 CIDR Block: 10.0.0.0/24
For IPv6 CIDR Block, select No IPv6 CIDR Block
For Tenancy, select Default as the value
Click Create VPC to complete the configuration.

c. You should see that your VPC has been created successfully. Click on the Your VPCs link in the left sidebar to see the VPCs.

3. Now, we shall create a new subnet in this VPC.
a. Click the Subnets link in the left sidebar and then click the Create Subnet button.

b. Enter the following values to create the subnet:
For VPC ID, select the VPC – Lab-VPC-Flow-Logs
Subnet name: Lab-VPC-Flow-Log-Subnet
For Availability Zone, select us-east-1a
IPv4 CIDR block: 10.0.0.0/26
Click Create Subnet to complete the configuration.


c. You should see that your subnet has been created successfully.

4. Let’s create an Internet Gateway that will be attached to the VPC.
a. Click on the Internet Gateways link in the left sidebar and then click the Create Internet Gateway button.

b. Enter the following values to create the internet gateway:
Name tag: Lab-VPC-Flow-Log-IG
Click Create Internet Gateway to complete the configuration.

c. You should see that your internet gateway has been created successfully. Click on Attach to VPC from the Actions menu.

d. Select the VPC – Lab-VPC-Flow-Logs and click on the Attach Internet gateway button.

5. Now, we shall create a route for this internet gateway in the main route table of the VPC.
a. Click on the Route Tables link in the left sidebar and then select the main route table for your VPC – Lab-VPC-Flow-Logs. Select the Routes tab and click on the Edit Routes button.

b. Click on the Add Route button, enter the destination as 0.0.0.0/0, and select the internet gateway – Lab-VPC-Flow-Log-IG – as the target. Click on the Save Changes button.

c. You should see that the route to the internet gateway has been added successfully.

You need to configure two separate VPC Flow Logs for the VPC created in the task above. The first VPC Flow Log will have the destination as CloudWatch Logs that can be used to create a metric filter and then create a CloudWatch alarm using this metric filter. The alarm will be triggered when a forbidden traffic event is detected. This, in turn, will send an email via SNS notifications. The second VPC Flow Log will have the destination as an S3 bucket, which will be used for analytics by leveraging Amazon Athena.
- Make sure that you are in the N.Virginia AWS Region on the AWS Management Console. Enter CloudWatch in the search bar and select CloudWatch service.

2. Let’s create the CloudWatch log group, which will be used as a destination for the VPC Flow Log.
a. Click on Logs from the left sidebar. Click on the Create log group button.

b. Enter the following values to create the CloudWatch log group:
Log group name: Lab-VPC-Flow-Log-Group.
Select the Retention setting as Never expire
Click on the Create button

c. You should see that the log group has been created successfully.

3. Navigate to the VPC service in the AWS Management Console.
a. Select Your VPCs on the left sidebar and then click on the link for the VPC ID for your VPC – Lab-VPC-Flow-Logs.

b. Select the Flow Logs tab for the VPC and click on the Create flow log button.

c. Enter the following values to create the VPC flow log:
Name: VPC-Flow-Log-Cloudwatch
For Filter, select All
For Maximum aggregation interval, select 1 minute
For Destination, select Send to Cloudwatch Logs

For the Destination log group, select Lab-VPC-Flow-Log-Group
For the IAM role, click on the Set up Permissions link

The link would open in a new browser window. Click on the Create role button.

For Trusted entity type, choose Custom trust policy. For Custom trust policy, replace “Principal”: {}, with the following:
“Principal”: {
“Service”: “vpc-flow-logs.amazonaws.com”
}
Then, click Next button.

Click on the Create Policy button

On the Create Policy page, do the following:
Choose JSON.
Replace the contents of this window with the following permissions policy.
{
“Version”: “2012-10-17”,
“Statement”: [
{
“Effect”: “Allow”,
“Action”: [
“logs: CreateLogGroup”,
“logs:CreateLogStream”,
“logs: PutLogEvents”,
“logs: DescribeLogGroups”,
“logs: DescribeLogStreams”
],
“Resource”: “*”
}
]
}
Click on the Next: Tags button and then click on the Next: Review button.

Enter flowlogsPolicy as the name for your policy and flowlogsPolicy as the description, and then choose Create policy.

Search and select flowlogsPolicy in the Add permissions section and then click on the Next button.

Enter the Role name and Description as flowlogsRole, then click on the Create role button.

You should see that the Role has been created successfully.

In the original browser window, click on the refresh icon next to the IAM role dropdown, and you should be able to see the new role.

Keep the Tags values unchanged and click on the Create flow log button.

You should see that the flow log has been created successfully.

4. Now, you must create an S3 bucket to be used as a destination for the second VPC Flow Log.
a. Navigate to the S3 service in the AWS Management Console.

b. Click on the Buckets link on the left sidebar and then click on the Create bucket button

c. Enter the following values to create the bucket:
Bucket name: lab-vpc-flow-log-bucket (You will need to select a different name as S3 bucket names must be globally unique)
For AWS Region, select US East (N. Virginia) us-east-1

Keep all other values unchanged and click on the Create bucket button at the bottom of the screen.

You should see that the S3 bucket has been created successfully.

Click on the bucket name, go to the Properties tab and copy the bucket ARN which will be used in the next step while creating the VPC flow log.

5. Let’s create the second VPC Flow Log with the destination as an S3 bucket.
a. Navigate to the VPC service on AWS Management Console and select the VPC that you already created. Select the Flow Logs tab and click the Create Flow Log button.

b. Enter the following values to create the VPC flow log:
Name: Lab-VPC-Flow-Log-S3
For Filter, select All
For Maximum aggregation interval, select 1 minute
For Destination, select Send to Amazon S3 bucket

Paste the value for the S3 bucket ARN that you copied earlier and click on Create flow log button.

You should see that the second VPC flow log has also been created successfully.

You will need to provision an EC2 instance in the public subnet of the VPC that you have already created. You will also create a Security Group to allow SSH access into the instance.
- Make sure that you are in the N.Virginia AWS Region on the AWS Management Console. Enter EC2 in the search bar and select EC2 service.

2. Let’s create a security group to allow SSH into the EC2 instance.
a. Select Security Groups from the left sidebar and click on the Create Security Group button

b. Enter the following values to create the security group:
Security group name: Lab-SSH
Description: Lab-SSH
For VPC, select Lab-VPC-Flow-Logs

Click on the Add rule button and configure values for the inbound rule for SSH access as shown below:
Type: SSH
Protocol: TCP
Port Range: 22
Source: Custom
Put the source IP value as 0.0.0.0/0
Note – For production systems, you should not have such open SSH access from any source. You should allow SSH only from your own public IP.
Click on Create Security group

You should see that your security group has been created successfully.

2. Now, we will provision the EC2 instance.
a. Click on the Instances link on the left sidebar and click on the Launch Instances button.

b. Choose Amazon Linux 2 AMI

c. Choose t2.micro as the instance type. Do not select any key pair, as we shall use EC2 Instance Connect to SSH into the instance.

d. Click on the Edit button in the Network settings section

e. Configure Network settings as follows:
Select Lab-VPC-Flow-Logs as the Network
Select Lab-VPC-Flow-Log-Subnet as the Subnet
For Auto-assign Public IP, select Enable

f. Configure the security group. Click on Select existing security group and then select Lab-SSH security group

g. Leave the values unchanged for the Configure storage section.
h. Leave the values unchanged for the Advanced details section.
i. Review the instance launch details and then click on the Launch button.

I will leverage CloudWatch metric filter and CloudWatch alarm to monitor AWS VPC Flow Logs that are ingested into CloudWatch Logs. To simulate the forbidden traffic type, you will create an outbound deny rule for all ICMP traffic in the VPC NACL. You will then set up a metric filter that watches over any rejected pings from the EC2 instance. This metric filter is further linked to a CloudWatch alarm that sends an email via SNS notifications whenever a rejected ping is detected.
- Navigate to the EC2 service in the AWS Management Console.
a. Click on Instances in the left sidebar and then select the EC2 instance you have already created. Click on the Connect button.

b. Select the EC2 Instance Connect tab and click on Connect.
c. Lets send some traffic over the ICMP protocol by sending a ping to google.com. Type the command `ping google.com` on the terminal window and press Enter. Enter Ctrl+C after you receive a few packets. Also, copy the IP address for google.com seen in the response (in this case, it is 172.217.2.110, as shown below)
2. Navigate to the VPC service in the AWS Management Console.
a. Select Your VPCs on the left sidebar and then click on the link for the VPC ID for your VPC – Lab-VPC-Flow-Logs.
b. Select the Flow Logs tab for the VPC and click on the destination CloudWatch Log link – Lab-VPC-Flow-Log-Group
c. Click on the log stream for the ENI of the EC2 instance.
d. Search for the IP address (copied in Step 1) in the log events. You should see matching traffic records in the VPC flow log. You should also note that the entries are marked as ACCEPT.
3. Navigate to the VPC service in the AWS Management Console.
a. Click on the Network ACLs link in the left sidebar. Then click on the Network ACL ID for the subnet Lab-VPC-Flow-Log-Subnet.
b. Select the Outbound Rules tab and click the Edit Outbound Rules button.
c. Click on the Add new rule button and enter the following values:
Rule number: 90
Type: All ICMP – Ipv4
Protocol: ICMP
Port range: All
Destination: 0.0.0.0/0
Allow/Deny: Deny
Click on Sort by rule number and finally, Save changes.
4. Navigate to the CloudWatch service in the AWS Management Console. Click on the Log groups link in the left sidebar and select the Lab-VPC-Flow-Log-Group log group.
a. Select the Metric filters tab and click on the Create metric filter button.
b. Enter the values for the filter pattern as follows:
Filter pattern:
[version, account, eni, source, destination, srcport, destport, protocol="1", packets, bytes, starttime, endtime, action="REJECT", flowlogstatus]For the Test pattern, select Custom log data as the log data to test. Then enter the following log event messages:
- 2 609242387670 eni–01a7afa7d0e999a73 10.0.0.49 172.217.9.206 0 0 1 33 2772 1621577928 1621577987 REJECT OK
- 2 609242387670 eni–01a7afa7d0e999a73 18.206.107.25 10.0.0.49 19653 22 6 70 7047 1621576794 1621576852 ACCEPT OK
- 2 609242387670 eni–01a7afa7d0e999a73 10.0.0.49 18.206.107.25 22 19653 6 57 9761 1621576794 1621576852 ACCEPT OK
- 2 609242387670 eni–01a7afa7d0e999a73 10.0.0.49 172.217.12.208 0 0 1 33 2775 1621577938 1621577998 REJECT OK
Click on the Test pattern button, and it should show the rejected results. Then click on the Next button.
c. Assign metric values as shown below:
Filter name: Lab-VPC-Flow-Log-Ping-Deny
Metric namespace: Lab-VPC-Flow-Log-Ping
Metric name: Ping-Deny
Metric value: 1
Click on the Next button.
d. Review and click on the Create metric filter.
e. Select the checkbox for the metric filter Lab-VPC-Flow-Log-Ping-Deny and then click on the Create alarm button.
f. Enter values for the alarm metric and conditions:
Metric-name: Ping-Deny
For Statistic, select Sum
For Period, select 1 minute
For the Conditions section, select Static as the Threshold type, select alarm condition as Greater/Equal and enter threshold value as 1. Click on Next to proceed.
g. Enter values for the alarm action:
For the Alarm state trigger, select In alarm
For the SNS topic, select Create a new topic
Enter CloudWatch_Alarms_Ping_Deny as the name for the new topic
Enter your email address as the email endpoint
Click on the Create Topic button and then click on the Next button at the bottom of the screen.
h. Enter CloudWatch-Alarm-Ping-Deny as the Alarm name.
i. Preview the details and click on the Create alarm button.
j. You should see that the alarm has been created successfully.
k. Before we proceed to trigger the alarm, you should access your email inbox and confirm the subscription for the SNS topic subscription.
l. You should see that the subscription has been confirmed successfully.
5. Navigate to the EC2 service in the AWS Management Console.
a. Click on Instances in the left sidebar and then select the EC2 instance you have already created. Click on the Connect button.
b. Select the EC2 Instance Connect tab and click on Connect.
c. Lets try to send some traffic over the ICMP protocol by sending a ping to google.com. Type the command `ping google.com` on the terminal window and press Enter. Since the NACL has a deny rule for the outbound ICMP traffic, you would not receive any response. Enter Ctrl+C to exit.
d. This would result in a REJECT event for the CloudWatch metric filter that would trigger the CloudWatch Alarm. Navigate to the CloudWatch service in the AWS Management Console and click on the Alarms link on the left sidebar. Select the alarm CloudWatch-Alarm-Ping-Deny to view the details. You may need to wait for a few minutes for the alarm state to change to In alarm.
e. You should also receive an email with the details of the alarm.


To implement this step, you need to set up an Athena table that reads the VPC Flow Logs data from S3 to analyze the access trends for the VPC Flow Logs stored in S3. You will write an Athena query to analyze the logs with the rejected traffic records.
- Make sure that you are in the N.Virginia AWS Region on the AWS Management Console. Enter S3 in the search bar and select S3 service.

You should see the S3 bucket that you have already created.

Follow the folder path to inspect the VPC flow logs already created in this S3 bucket. You should see multiple log files at the end of the folder path like so:

2. Let’s create a folder in your S3 bucket that will be used to save the Athena query results
a. Navigate to your S3 bucket and click on the Create folder button

b. Enter the folder name as AthenaQueryResults and click on the Create folder button

3. You will now create the Athena database and table for analyzing the VPC flow logs.
a. Navigate to the Athena service in the AWS Management Console.

b. You will see a prompt to configure a query result location. Click on the link to complete this configuration.

c. Enter the S3 location as the query result location. Click on the Save button.

d. Enter the query – CREATE DATABASE lab – to create your Athena database. Click on the Run query button.

e. Now, you will create the Athena table that will be used to analyze the VPC flow logs. Run the following query. Make sure that you modify the table location to fit your S3 bucket and the account ID.
- CREATE EXTERNAL TABLE IF NOT EXISTS lab.vpc_flow_log (
- version int,
- account string,
- eni string,
- source string,
- destination string,
- srcport int,
- destport int,
- protocol int,
- packets int,
- bytes bigint,
- starttime int,
- endtime int,
- action string,
- flowlogstatus string
- )
- PARTITIONED BY (
- `year` string,
- `month` string,
- `day` string)
- ROW FORMAT DELIMITED
- FIELDS TERMINATED BY ‘ ‘
- LOCATION ‘s3://lab-vpc-flow-log-bucket/AWSLogs/609242387670/vpcflowlogs/us-east-1/’
- TBLPROPERTIES (“skip.header.line.count”=“1”);

f. Add partitions to the table by running the following query. Make sure that you modify the partition date values and the location path to fit your S3 location.
- ALTER TABLE lab.vpc_flow_log
- ADD PARTITION (year=‘2021’, month=’05’, day=’21’)
- location ‘s3://lab-vpc-flow-log-bucket/AWSLogs/609242387670/vpcflowlogs/us-east-1/2021/05/21’;

g. Next, load the partitions to ensure the data is available in the table. Run the following query:
MSCK REPAIR TABLE lab.vpc_flow_log;

4. Now, you can analyze the VPC Flow Logs data using Athena.
a. Lets run a query to see the outbound traffic (for this case, the source IP as 10.0.0.49. You will need to use the private IP for your EC2 instance that you already created) on ICMP protocol (protocol = 1). Run the following query:
- SELECT CONCAT(year, ‘-‘, month, ‘-‘, day) date, eni, source, destination, starttime, endtime, action, protocol
- FROM lab.vpc_flow_log
- WHERE source = ‘10.0.0.49’ AND protocol = 1
- order by start time
You can see that initially the traffic was ACCEPTed since the NACL did not have an outbound rule to deny the ICMP traffic. Once the rule was created, all subsequent ICMP traffic was REJECTed from the given source.

b. Let’s run a query to analyze all types of REJECTed traffic.
- SELECT CONCAT(year, ‘-‘, month, ‘-‘, day) date, eni, source, destination, starttime, endtime, action, protocol
- FROM lab.vpc_flow_log
- WHERE action = ‘REJECT’
- order by starttime
You can see that the TCP traffic (protocol=6) and UDP traffic (protocol=17) has been REJECTed for the given ENI.

In this way, we have demonstrated that the VPC flow logs data is useful for monitoring and analyzing the traffic patterns across your VPC, subnets and any ENIs within your VPC.
As part of this project, I created a custom VPC, an EC2 instance and a VPC Flow Log to monitor the traffic for the instance.
- Navigate to the EC2 service on the AWS management console. Select the Instances link on the left sidebar. Select the EC2 instance that you created. Click the Instance state button, select Terminate instance and then click on Terminate.

2. Navigate to the CloudWatch service.
a. Delete the log group – Lab-VPC-Flow-Log-Group
b. Delete the CloudWatch alarm: CloudWatch-Alarm-Ping-Deny
c. Navigate to the Athena service on the AWS management console and delete the table vpc_flow_log

3. Navigate to the S3 service, click on your S3 bucket and then delete all content for your S3 bucket (for this case, lab-vpc-flow-log-bucket)

Type permanently delete in the confirmation textbox and then click on the Delete objects button.

Now, navigate back to the S3 service and delete your S3 bucket by selecting your S3 bucket name and then clicking on the delete button.

Type in the name of your S3 bucket and click on the Delete bucket button.

4. Navigate to the VPC service on the AWS management console. Let’s delete the resources with the following names:
Subnet: Lab-VPC-Flow-Log-Subnet

Internet Gateway: Lab-VPC-Flow-Log-IG
You need to detach the Internet Gateway from the VPC

Then, delete the Internet Gateway.

VPC Flow Logs: VPC-Flow-Log-Cloudwatch, Lab-VPC-Flow-Log-S3

Route Table: Lab-VPC-Flow-Logs

VPC: Lab-VPC-Flow-Logs
Click on the Your VPCs link on the left sidebar, then select your VPC Lab-VPC-Flow-Logs, click on the Actions menu and select Delete VPC.
